
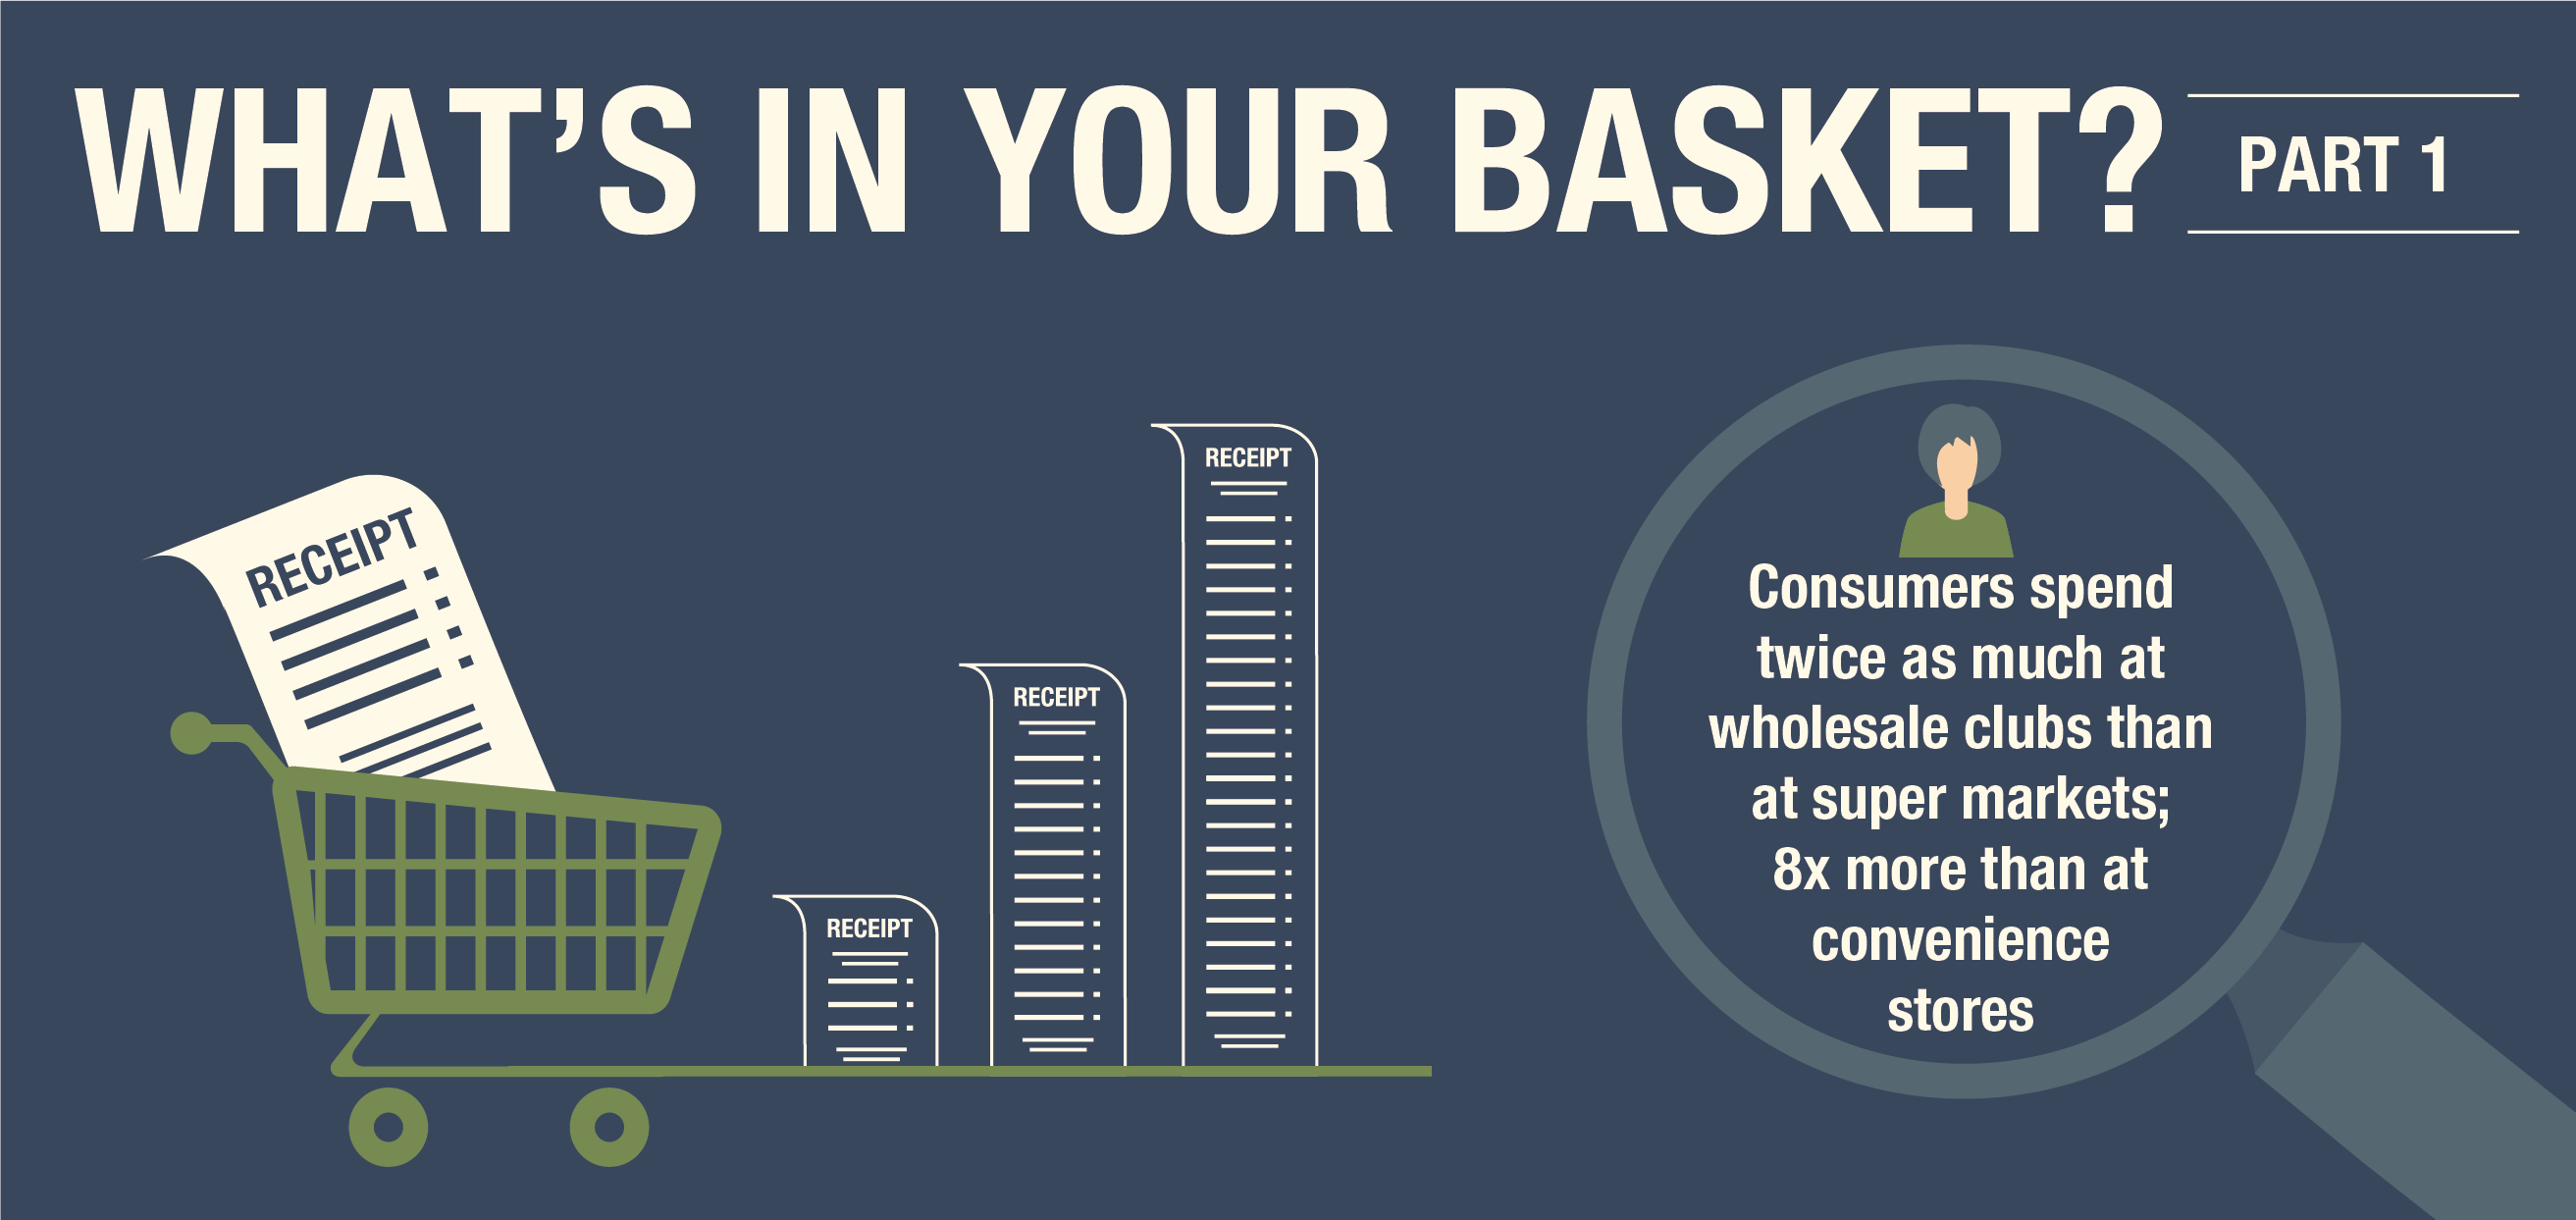
It’s very seldom that a CPG brand has any access to a store POS system, a fact that severely limits the kind of data they can access. But this data often contains some of the important metrics a brand needs; insight into how different retail channels are contributing to overall revenue. At the end of the day, a marketing strategy is only as good as the revenue it generates, so understanding the cause and effect relationship between consumer spend and marketing is essential for a brand’s survival. In this inaugural “What’s In Your Basket”, we show you how data from receipts can inform brands how the spending habits of consumers changes between two popular retail channels at very different ends of the spectrum: wholesale clubs and convenience stores. We’ll also show how brands can utilize this knowledge to actively adapt and win and an increasingly competitive retail environment.
Average Spend Per Customer Visit
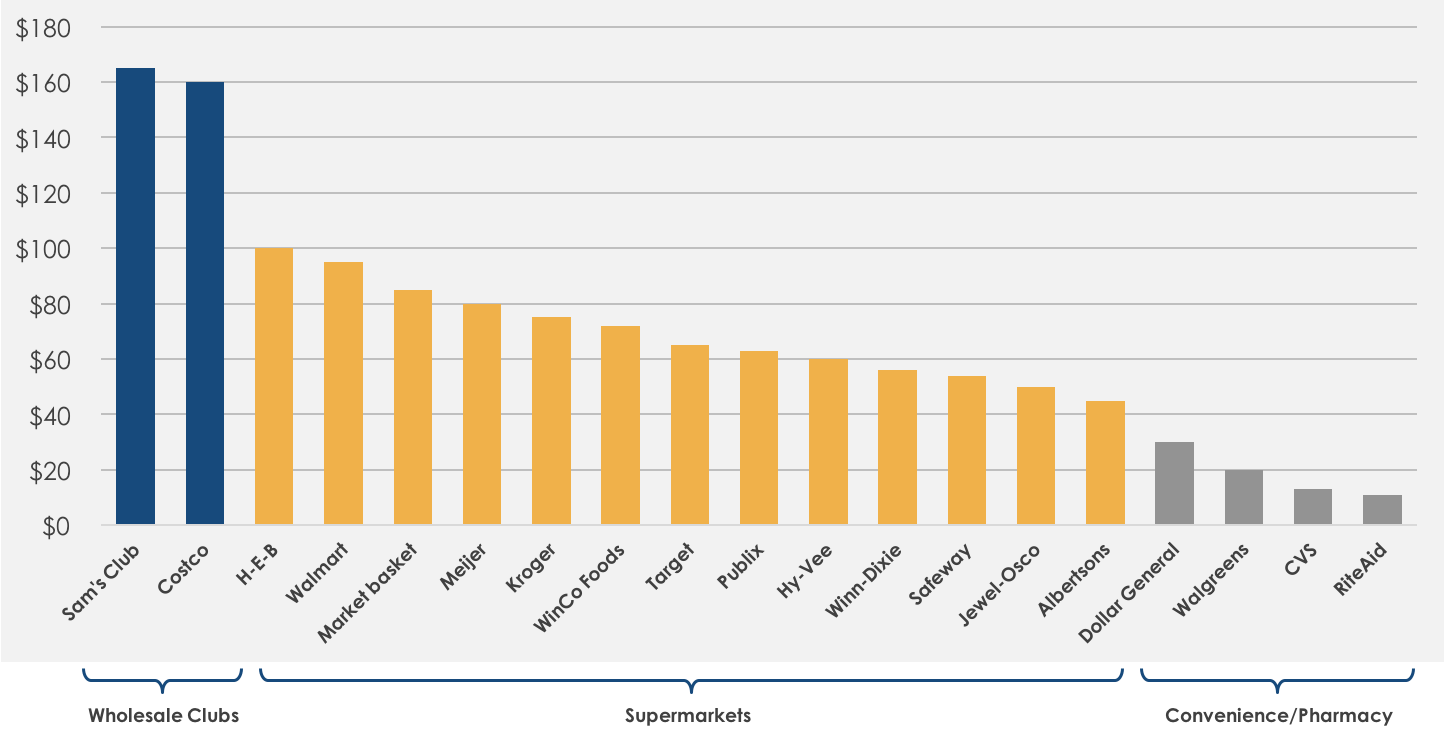
The chart above shows the average spend per customer visit for some of the largest retailers in the US. In addition to giving us an idea of how spending patterns vary by retailer, the average spend is extremely useful in determining the “pull” of a particular promotion; if a particular customer’s receipt total is significantly less than the average spend for that retailer (and the particular item constitutes a large share of the total basket spend) then it’s safe to assume the customer came into the store specifically for that program.
From the chart above, we can see how the type of retailer affects overall spend:
- Large wholesale club-style retailers see the highest spending (Sam’s Club and Costco shoppers spend about $160 per trip) while When consumers go to these stores, they often make a concerted effort to stock up and save on a large array of products.
- Supermarkets and discount stores, represented largely in the middle, have an average spend of between $45 and $90 per visit.
- Convenience stores and pharmacies are at the other end of the scale; consumers don’t spend nearly as much here (CVS and Walgreens shoppers spend around $20 per trip).
The spend within a retailer type is just as informative:
- Walmart’s average spend per visit is almost 50% greater than Target, which is its next biggest competitor in the discount store space.
- Certain regional supermarkets (HEB, Market Basket, Meijer) are doing significantly better than national chains on an average spend per visit basis
- Not surprisingly, the spend at deep discount stores like Dollar General is significantly lower than average
That’s it for this week! But there’s lots more data to examine. Did you know that you can look at data by date and time, and see exactly when consumers are most likely to making purchases for your program? We’ll be examining that in the next entry!
CLICK HERE TO READ ALL ARTICLES IN THE “WHAT’S IN YOUR BASKET” SERIES