Our “What’s In Your Basket?” series is designed to show knowledge-hungry brands the possibilities at the intersection of data and technology. From deep consumer behaviors to critical information on KPI’s, technologies like receipt processing are irreplaceable in the modern marketing landscape.
This entry will highlight perhaps the most important aspect of basket analysis for many brands, and quite possibly the most elusive; understanding which products consumers are actually buying when they shop.
We took a look at data from major CPG brands, accumulated by our SnippCheck receipt processing technology and fed into our SnippInsights analytics platform, to understand which of the brand’s products were preferred by consumers.
BRAND ANALYSIS
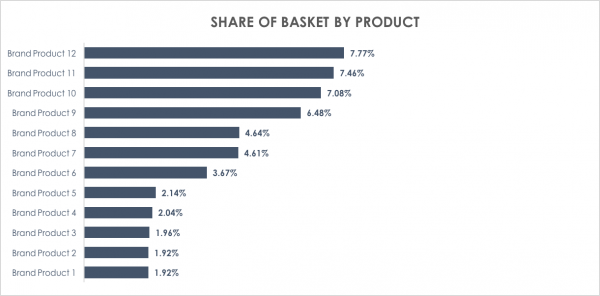
Receipt data allows for a glimpse into how consumers are purchasing from a brand’s portfolio. First off, let’s look at the “share of basket” data we gathered:
Overall, this brand had a 58.26% share of basket; that means 58% of the value (purchase price) of all products from the receipts being analyzed comprised of the brand’s products. But if we break down this number even further, we can see how individual products contribute to the overall value of the total basket (in this case, product 1 has the highest share of basket figure):
If we want to further analyze a brand’s product portfolio, we can look at how products at shelf compare to each other on a number of important metrics.
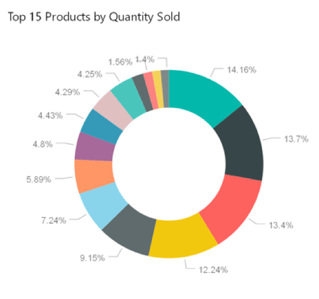
- “Top 15 Products by Quantity Sold”: we can see exactly which brands items are most popular, and which are least popular, based on volume of quantity:
-
By the revenues they are generating for the brand with the “Top 15 Products by Sales Amount” data:
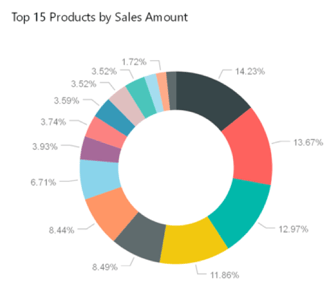
This difference is key to a brand’s strategic analysis; for example, from the charts analyzed, it’s apparent that “product 1” tops all sales in terms of revenues, but it is not the most popular by quantity – that spot is reserved “product 3”.
One further observation we can make is the fact that even though “product 3” is the most popular by quantity sold, it is only third in in terms of sales revenues and share of basket.
All of this data allows brands to constantly re-evaluate and update their marketing efforts. The actual strategies a brand could draw out of this data are practically endless, but here are a few hypothetical examples of how the information might tie into the decision-making process:
- If a brand needs to sell more of “product 5”, should they offer a promotion to drive more sales?
- If the reports for the past 6 months show that “product 1” is the most stable in all metrics, is there a loyalty opportunity the brand can capitalize on or investigate further?
- Share of basket for the brand’s portfolio overall has been decreasing; would a co-branded promotion help boost that number?
- Revenues for product 2 are exceeding KPI objectives, but the quantity metrics are lagging; could a rebate offer help boost quantity without affecting revenue goals?
COMPETITIVE ANALYSIS
The ability to look into a brand’s own portfolio is lucrative enough, but the beauty of receipt data is for the ability to capture data on other brands and categories on the receipt. To show what can be accomplished, here is a visualization showing how consumers purchase other brands:
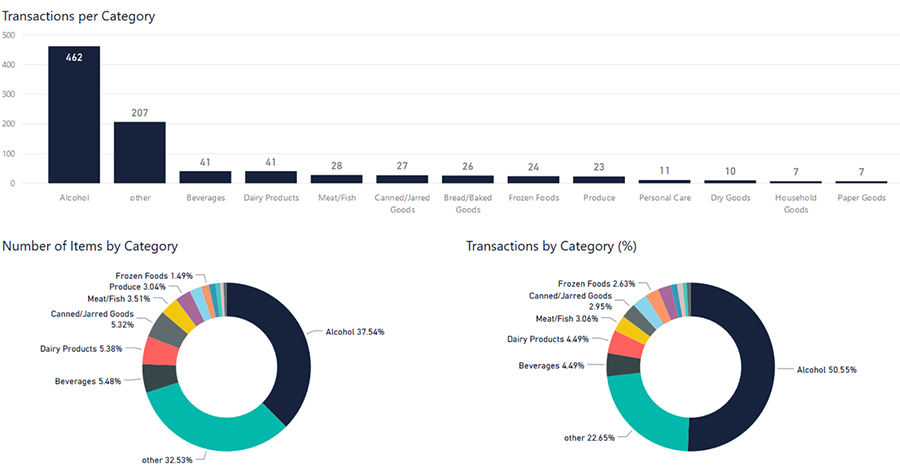
Transactions per brand: This statistic shows the number of purchases each brand has racked up in the data set.
Transactions by brand %: Explains the ratio for each brand transaction compared to the entire data set.
Number of items by Brand: Multiple items may be in the basket for a single purchase (receipt), so this figure breaks down how many items for each brand consumers are buying.
What kinds of marketing insights can be drawn from data such as this?
- Do any brands that are popular choices amongst consumers compete with my own?
- How do my percentages stack up against other brands?
- Is there an opportunity for a co-branded promotion?
- Brand A has increased the number of items purchases by x% over the past 6 months…let’s undertake further competitor analysis to analyze their marketing efforts.
Thanks for checking out this installment of “What’s In Your Basket?”, and keep your eye out for our next entry!
CLICK HERE TO READ ALL ARTICLES IN THE “WHAT’S IN YOUR BASKET” SERIES